Minutes of Meetings
By Ariana / Feb 4, 2023The discussions of the meetings were noted and penned for for clarity.
Read MoreThere are many reasons why tourists come to Tanzania.
The team will use a range of visualisation techniques to analyse and reveal insights on tourism spending.
As showcased in the RShiny app, users will be able to:
What type of tourist spend the most? What causes these type of tourist to spend more? Can we replicate this to encourage other tourists spend more? These are some questions that we hope to answer.
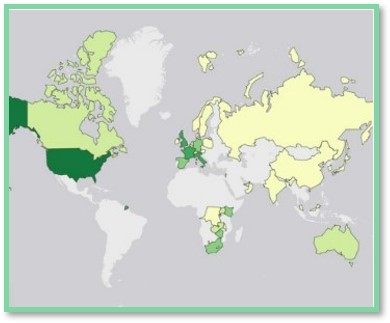
Which country should the Tourism board spend more investment dollar? What is the reason for travellers from each country to come into Tanzania? This app will uncover these insights
Applying different machine learning techniques such as random forest and decision tree, this app will try to predict certain spending behaviours based on different factors and patterns.
The team analysed from the overall statistical analysis
to individual contry profile and spending behaviour
9,170
Total Visitors
39,02 mil
TSZ Spent in total
8,736 mil
TSZ Spent by Top country: USA
11 nights
Spent on avg per tourist
The aims to build an app that would give insights to
tourist spending behaviour


One glance view of the entire project
How the Team came to this idea and
the process of app development

The discussions of the meetings were noted and penned for for clarity.
Read More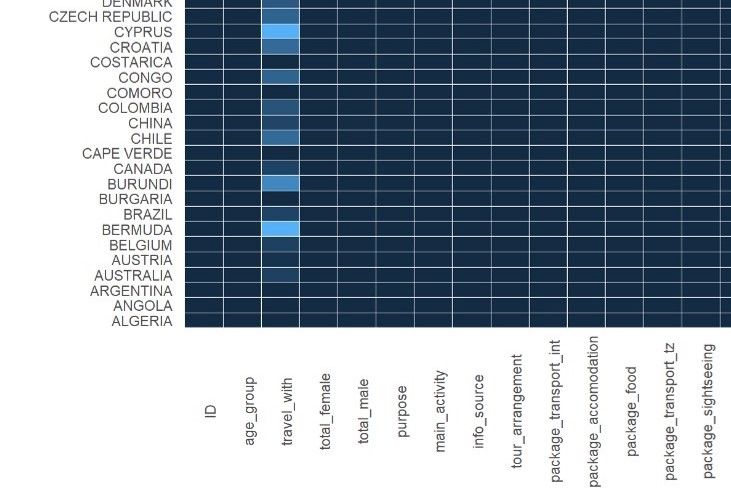
Data wrangling was done to check for missing data. Countries were mapped to country codes etc.
Read More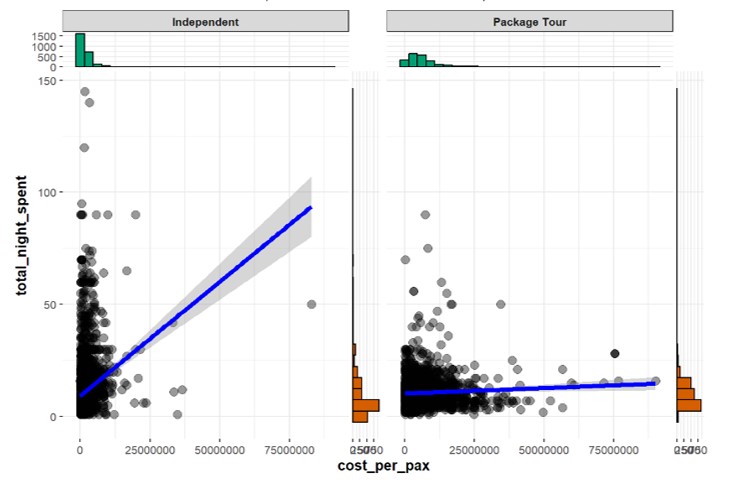
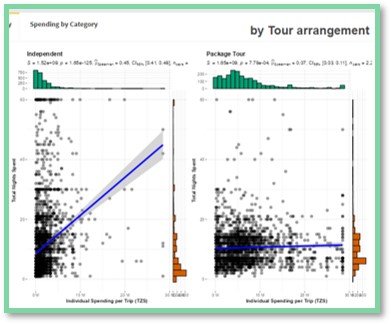
Correlation graphs were explored to find interesting findings.
Read More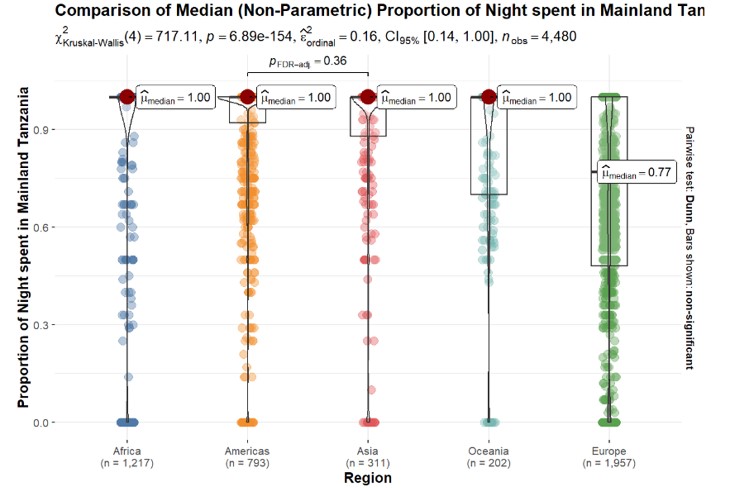
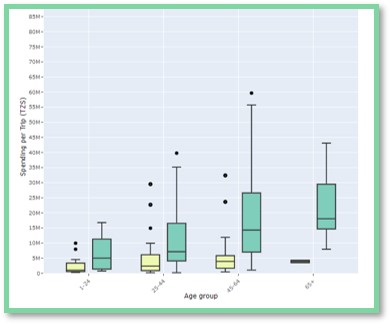
Analysis was performed for descriptive, numerical variables, regions and countries.
Read More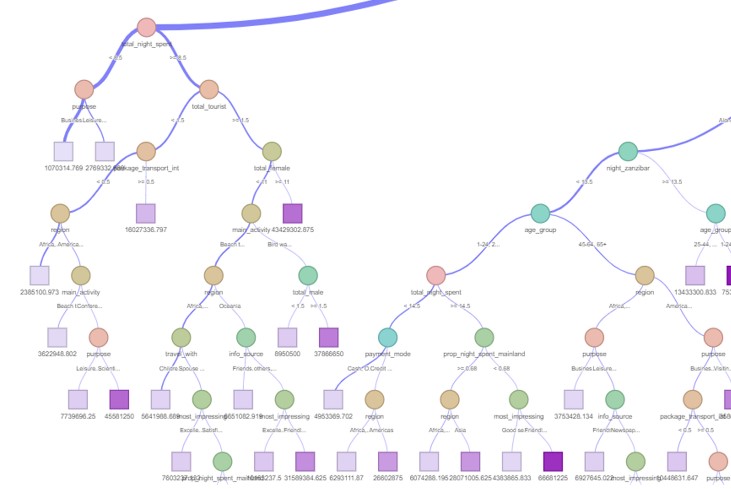
Both regression tree analysis and random forest analysis were performed to explore the useability.
Read More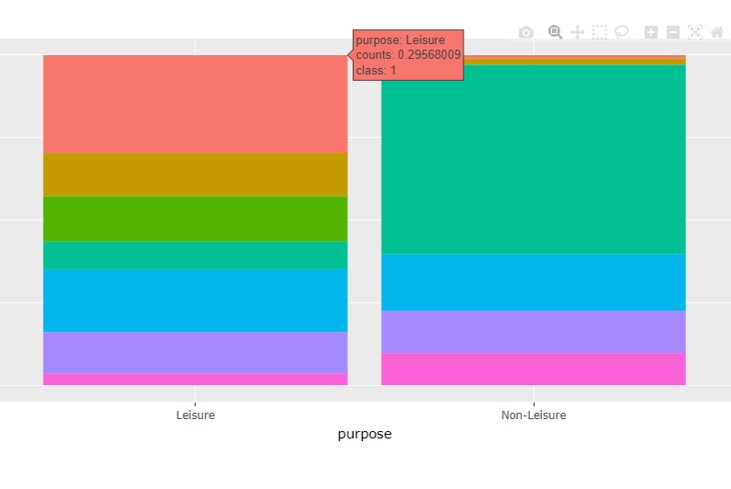
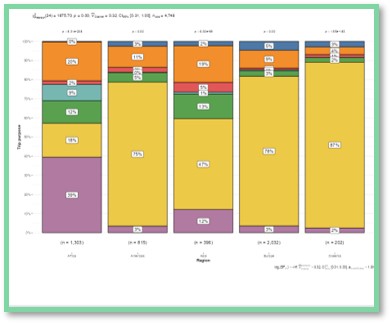
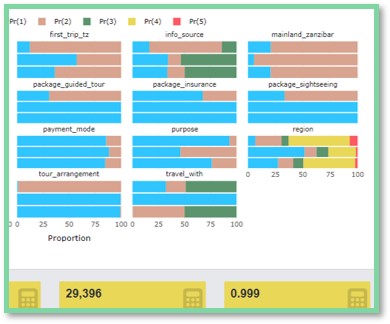
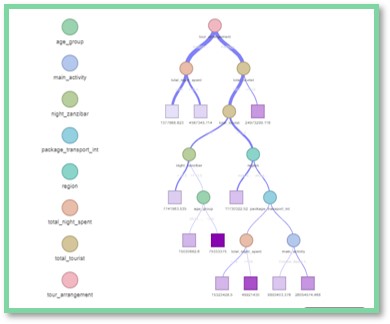
Latent class analysis was done for categorical variables and continuous variables binned.
Read MoreIf you have any feedback, drop us a note!